Curated Chrome was ours. We built the store, ran the ads, wrote the email and grew the account from September 2024 until we sold it in March 2026. Every dashboard on this page is the real one.
The store line is derived: Meta’s purchase value at its measured 26.6 percent share of store revenue.
2.92xreturn on ad spendas Meta reported it
124kInstagram followersgrown from zero
$357kstore revenuefirst four months
Source. Meta Ads export, Klaviyo and Shopify, September 2024 to March 2026.
ExploreMeta, campaign level
Where the money went, campaign by campaign.
Pick a campaign to see what it spent and what came back. Three campaigns brought back 46 percent of the revenue. The chapters below take the account apart line by line.
InteractiveWhere the money wentCurated Chrome · Meta
Spent €48 242Came back €140 840
€7 659€33 086
CBO - Worldwide TestTop campaign
Spent
€7 659
Came back
€33 086
Return
4.32x
Purchases
126
Share of all spend16%
Share of all revenue23%
Three campaigns brought back 46% of the revenue.Results summary from Meta Ads Manager, Sep 2024 to Feb 2026. Campaign spend derived from revenue and return
01
Meta was a quarter of the store. That is the whole point.
Over seventeen months Meta reported €140 840 of
purchase value on €48 242 of spend. That is 2.92x, and on its own it is an
ordinary number. The interesting part is what the other three quarters of the store were doing.
Share of store revenue, 1 December 2025 to 22 March 2026
26.6%73.4%
Meta, measuredClaimed by the ad account
Everything elseOrganic, email, repeat, referral
The only window in which a complete campaign export and a store total both exist. Meta also claimed 23.2 percent of orders. A second check fifteen months earlier brackets the account between a tenth and a third of the store.
Route A, reported$357 000
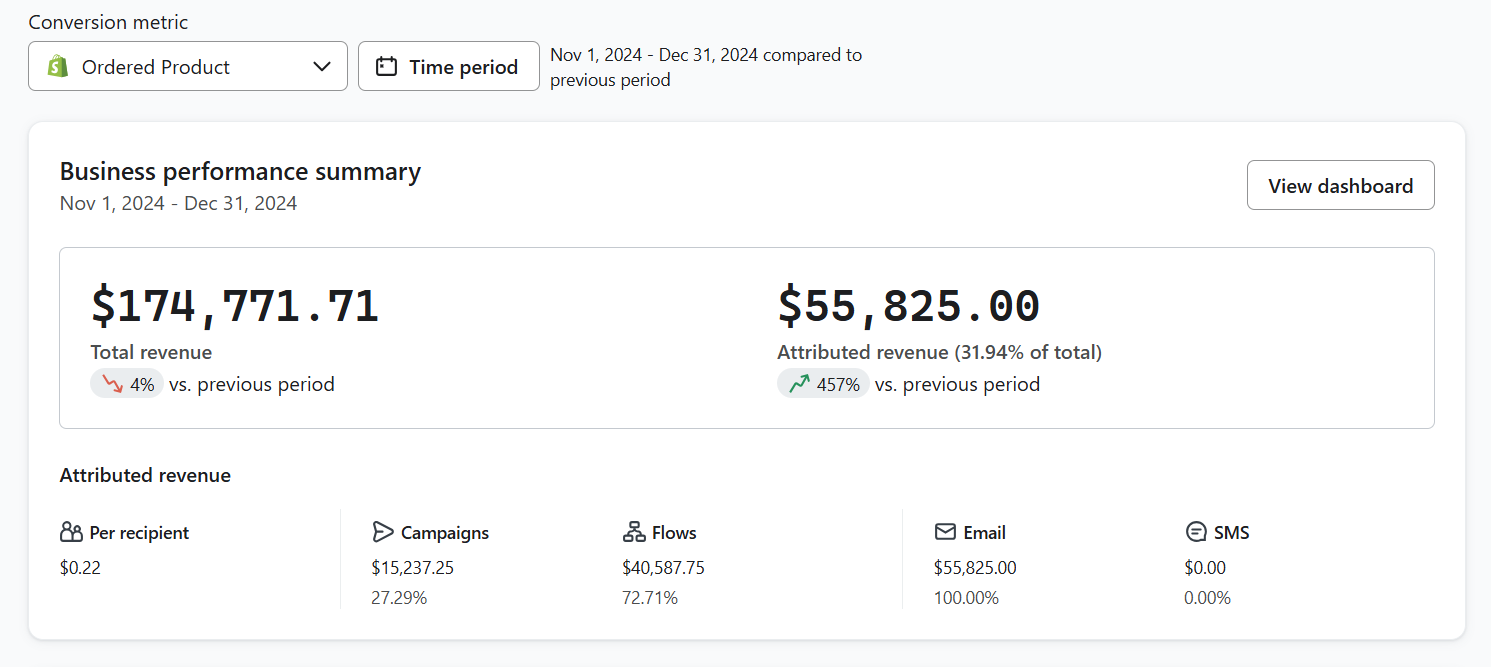
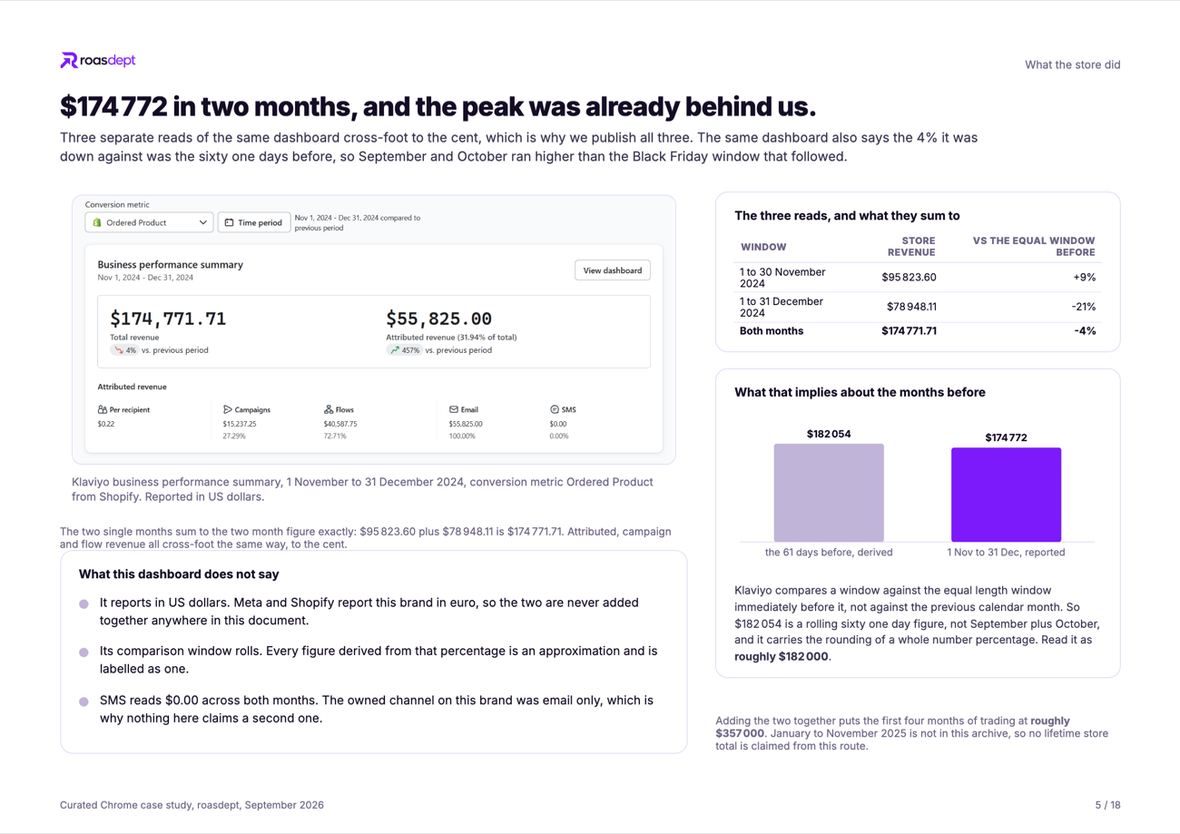
Store revenue across the first four months of trading, read off Klaviyo. November and December came in at $174 771.71, four percent under the equal length window immediately before it.
Route B, derived€529 000
Lifetime store revenue implied by €140 840 of Meta purchase value at the measured 26.6 percent share. An estimate, and labelled as one.
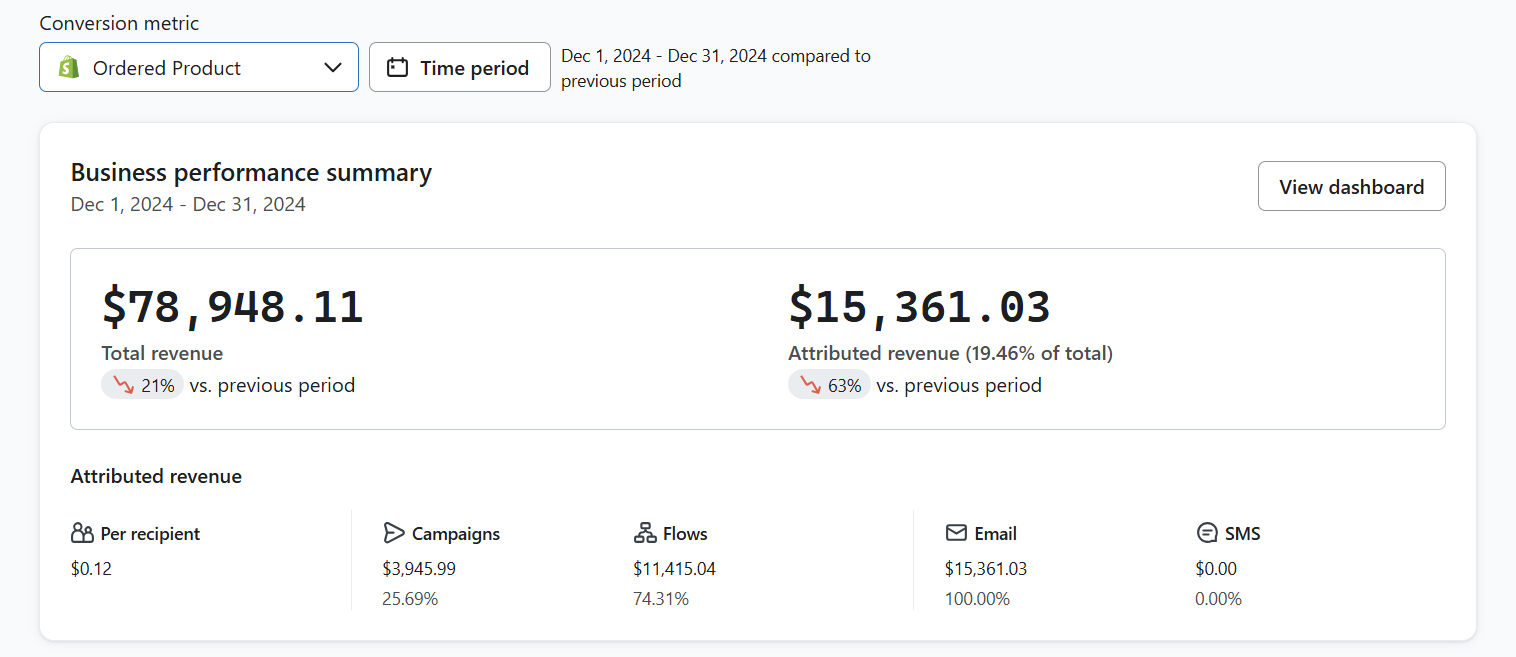
Klaviyo › Business performance
Klaviyo, 1 November to 31 December 2024. Two months out of the eighteen the store traded, and the read behind route A.
Two routes, two currencies, deliberately not added together. Klaviyo reported this store
in dollars; Meta and Shopify reported it in euro. Either route puts the store around half a million
against €48 242 of advertising.
02
One platform, one placement band, one age band.
Instagram took 97 percent of the money and returned 3.86x. Facebook took the
rest and returned 2.05x. Inside Instagram the budget split almost evenly across three placements, and the
return barely moved between them.
Spend by placement
Instagram Feed€10 439
Instagram Stories€8 455
Instagram Reels€8 288
Instagram Explore€644
Facebook Reels€201
Everything else€411
Return by placement
4.22xFeed
3.80xStories
3.41xReels
3.90xExplore
1.43xFB Reels
Meta Ads export, 21 September 2024 to 12 March 2026. Two charts
rather than two axes, so neither scale borrows credibility from the other.
Spend by age
18 to 24€16 710
25 to 34€9 349
35 to 44€1 392
45 to 54€540
55 to 64€234
65 and over€249
Under 35 carried 96 percent of the budget. The 18 to 24 band returned 4.14x, the best of any group.
Spend by country, top six
United States€14 042
Germany€2 507
France€2 107
Canada€1 211
Belgium€984
United Kingdom€946
Thirty two countries bought. The United States was 51 percent of spend at 3.96x. The United Kingdom, on a twentieth of that budget, returned 5.64x.
03
The line that got clicked was not the line that sold.
Every ad in the account, exported at ad level and sorted by spend. Discount
hooks won the click. Product names won the sale.
Ad headline
Spend
CTR
ROAS
Elevate Your Style with Curated Chrome
€2 921
4.08%
2.80x
STAND OUT
€2 320
3.10%
2.35x
Discover Handcrafted Accessories That Define You
€1 291
2.77%
2.79x
No headline set
€1 145
4.50%
3.91x
Save Up to 50% Off This Black Friday!
€979
4.26%
2.96x
Standout in a world of simple watches!
€838
5.03%
3.91x
Up to 40% OFF Curated Chrome! Act Now or Regret!
€341
8.55%
1.92x
Midnight Thorn Watch Out Now
€154
3.89%
16.56x
Meta Ads export, ad level. Twenty seven distinct headlines ran; these eight are the ones worth arguing about.
The strongest click through rate in the account, 8.55 percent, belonged to a forty percent
discount with an urgency threat, and it returned 1.92x. The strongest return, 16.56x, belonged to a sentence
that just named the watch.
So we stopped optimising on clicks.
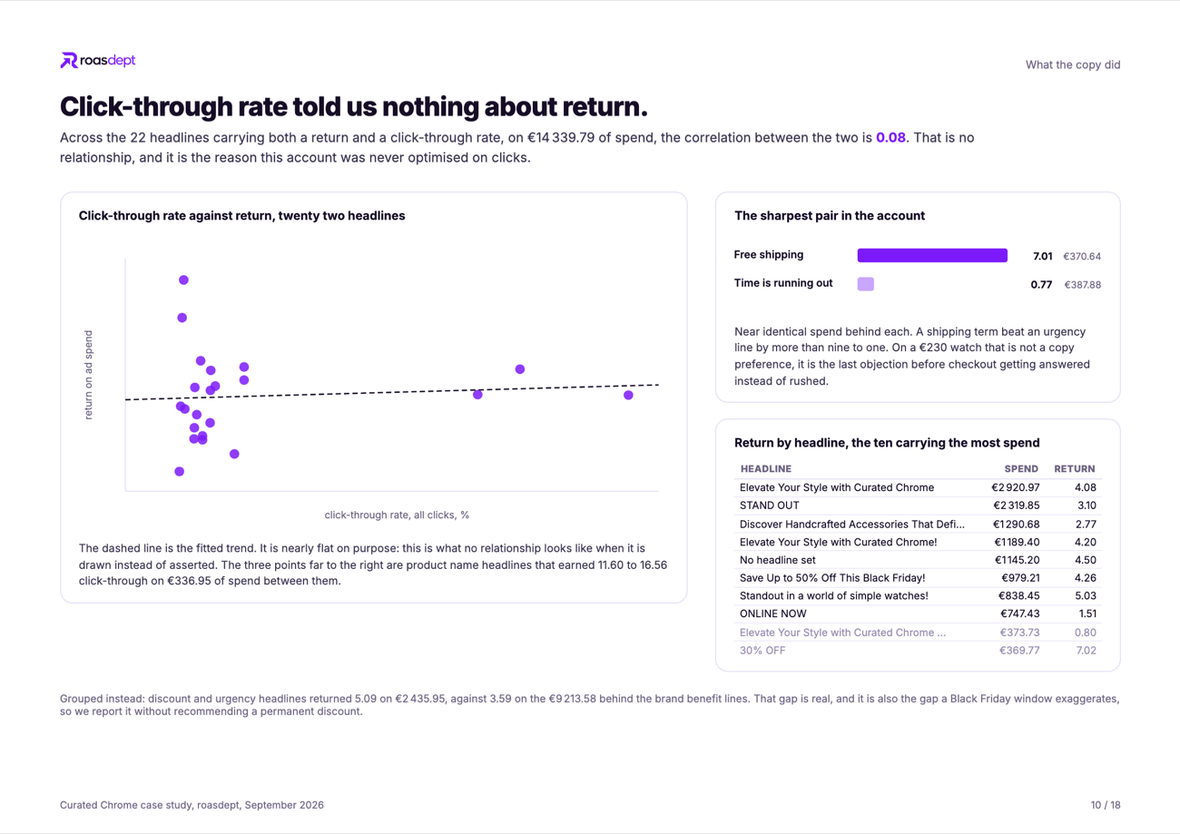
Across the 22 headlines carrying both a return and a click through rate, on €14 339.79 of spend, the
correlation between the two is 0.08. That is no relationship at all, and it is the
reason this account was never read on clicks.
Case study › What the copy did
The dashed line is the fitted trend, and it is nearly flat on purpose. This is what no relationship looks like when it is drawn instead of asserted.
The sharpest pair in the account ran on almost identical money.
Free shipping returned 7.01 on €370.64. Time is running out returned 0.77 on
€387.88. On a €230 watch that is not a copy preference. It is the last objection before checkout
getting answered instead of rushed.
Grouped rather than paired, discount and urgency lines returned 5.09 on €2 435.95
against 3.59 on the €9 213.58 behind brand benefit lines. That gap is real, and it is also the gap a
Black Friday window exaggerates, which is why we report it without recommending a permanent discount.
04
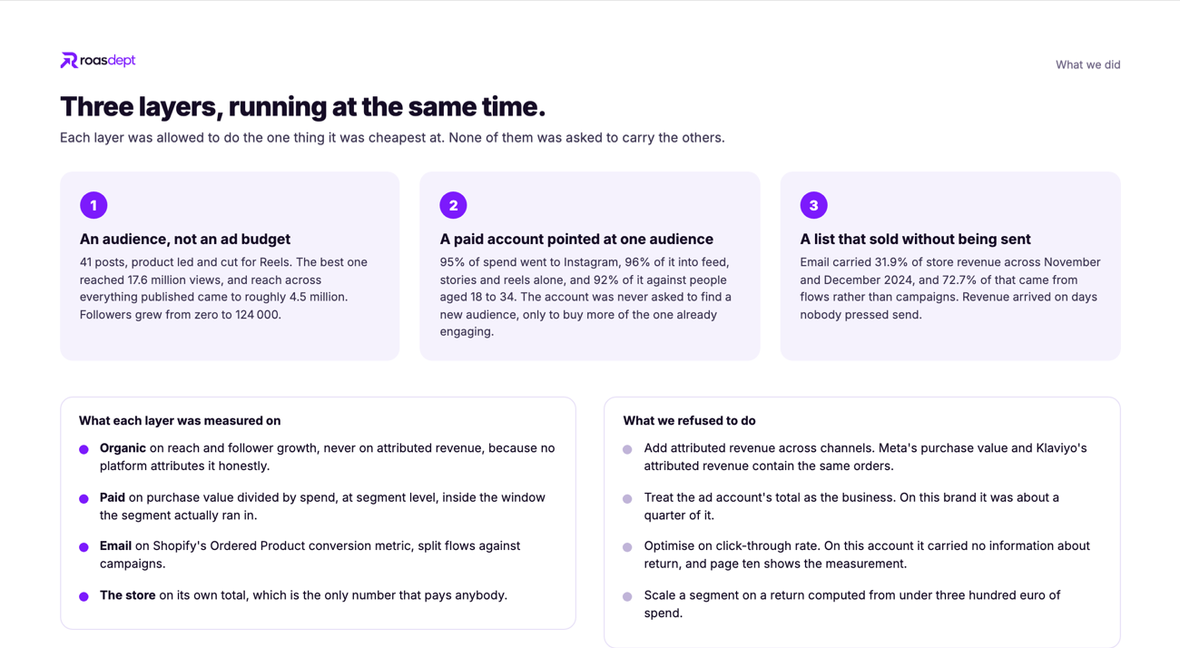
Forty one posts bought the audience the ads then rented.
This is the part Meta cannot report. Forty one posts over seventeen months
built an Instagram account of 124 000 followers, and the paid account was never
asked to find a new audience. It bought more of the one already engaging.
Posts published41
Product led and cut for Reels, shot in batches rather than daily.
Best reel17.6M
Views on a single post. Reach across everything published came to roughly 4.5 million.
Followers124 000
From zero, grown alongside the paid account rather than bought.
The loop that produced them
Batch
Shoot once, cut many
Product led stills and Reels cuts produced in batches, so one shoot day fills a month of feed.
Publish
Organic first, every time
An idea gets posted before it gets funded. The feed is the cheapest creative test in the business, and it costs nothing to lose.
Fund
Money goes behind what already holds
The posts that hold attention on their own become ads. Nothing is boosted on hope, which is why 96 percent of the budget could sit in three placements.
Compound
Reach buys an audience, the audience buys email
Followers arrive on the back of paid reach, join the list, and buy later on a channel with no media cost attached to it.
Case study › What we did
Organic, paid and email, each allowed to do the one thing it was cheapest at. None of them was asked to carry the others.
Each layer was measured on its own terms. Organic on reach and follower growth, never on
attributed revenue, because no platform attributes that honestly. Paid on purchase value divided by spend,
at segment level, inside the window the segment actually ran in. Email on Shopify ordered product. We never
add attributed revenue across channels, because Meta purchase value and Klaviyo attributed revenue contain
the same orders.
05
A list that sold without being sent.
Across November and December 2024 the store took $174 771.71. Email was
credited with $55 825.00 of it, and 72.71% of that
arrived from always on flows rather than campaigns. Revenue on days nobody pressed send.
Attributed email revenue, November and December 2024
72.71%27.29%
Flows$40 587.75, always on
Campaigns$15 237.25, sent by hand
Klaviyo business performance summary, conversion metric Ordered Product from Shopify. Attributed revenue was up 457 percent on the equal length window before it.
Klaviyo › November
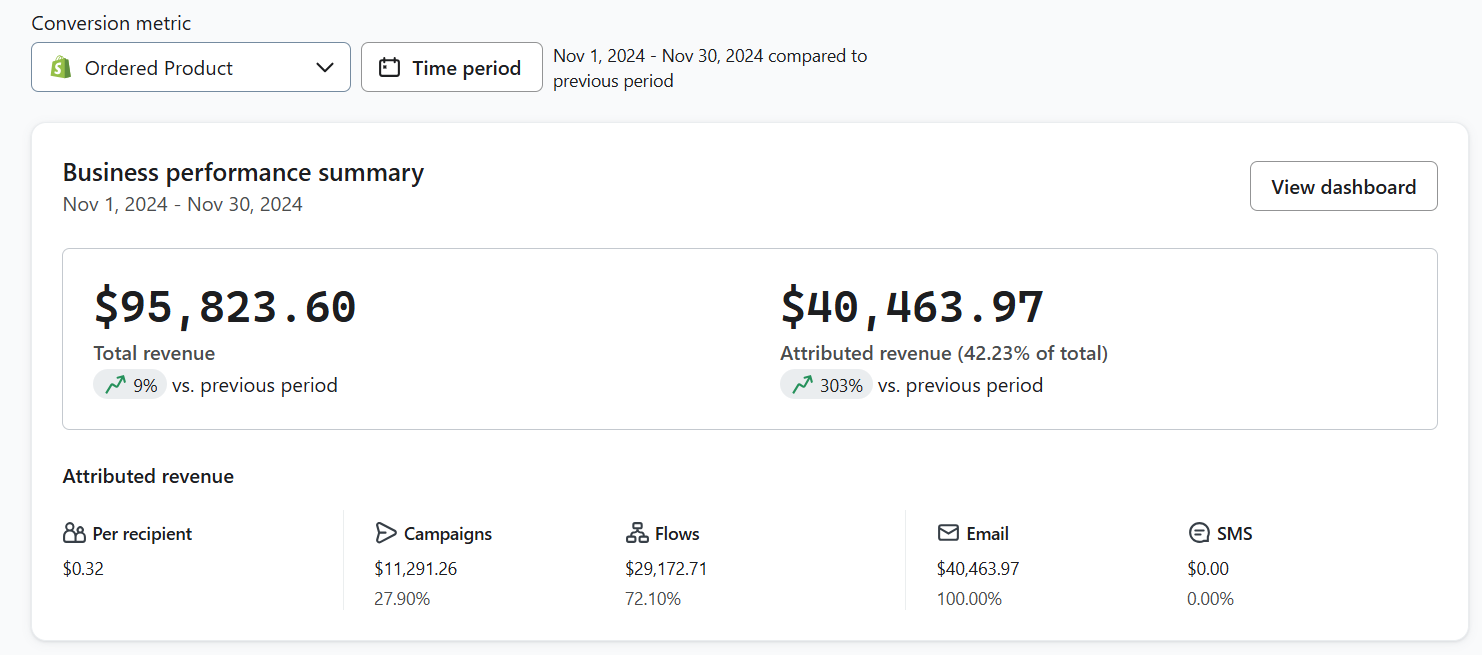
1 to 30 November 2024. $95 823.60, nine percent up on the window before it.
Klaviyo › December
1 to 31 December 2024. $78 948.11, and the peak was already behind us.
Three reads of the same dashboard
Window
Store revenue
Attributed to email
Vs the equal window before
1 to 30 November 2024
$95 823.60
$40 463.97
+9%
1 to 31 December 2024
$78 948.11
$15 361.03
−21%
Both months
$174 771.71
$55 825.00
−4%
The two single months sum to the two month figure exactly, to the cent. That is why all three are published rather than the flattering one.
Case study › What the store did
The same dashboard says the four percent it was down against was the sixty one days before, so September and October ran higher than the Black Friday window that followed.
Klaviyo reports this brand in US dollars. Meta and Shopify report it in euro, so the two
currencies are never added together anywhere on this page.
06
Margin is what made the return affordable.
A 2.92x blended return is only interesting next to the cost sheet. Watches
carried 42 to 58 percent. The small accessories carried 67 to 84 percent, and that is what paid for the
testing.
In the final window sessions fell 59 percent while sales rose 41 percent and
orders rose 50 percent. We were spending less and selling more, which is the only version of a wind down
worth writing about.
Sessions−59%
37 200 sessions across the final 112 days.
Total sales+41%
€34 000, on a fraction of the previous traffic.
Conversion rate+275%
0.43 percent, against 0.11 before it.
Shopify › Analytics
Shopify, all channels, 1 December 2025 to 22 March 2026.
The same funnel, tighter on every step
Step
Final window
Lifetime
Link clicks
12 371
255 946
Adds to cart, of clicks
2.73%
2.12%
Checkouts, of adds to cart
61.2%
87.6%
Purchases, of checkouts
20.8%
11.7%
Clicks to purchase
0.35%
0.22%
The final window sits inside the lifetime column, so these are percentages to compare and counts to ignore. What was left at the end was the audience, and the audience converted at nearly twice the lifetime rate.
The relaunch itself is the honest counterweight. €4 578.52 of spend returned
€9 040.46 of reported purchase value across 43 purchases, a blended 1.97 at €106.48 a purchase.
On a €230 entry watch that is a loss on paid traffic alone. The audience that had carried three
quarters of the revenue was no longer being fed, and rebuilding it would have taken another eighteen months
of posting.
So the brand was wound down deliberately rather than left to drift, and the domain, the catalogue, the
audience and the automations were sold together on 23 March 2026 through Flippa, with escrow settled two
days later.
08
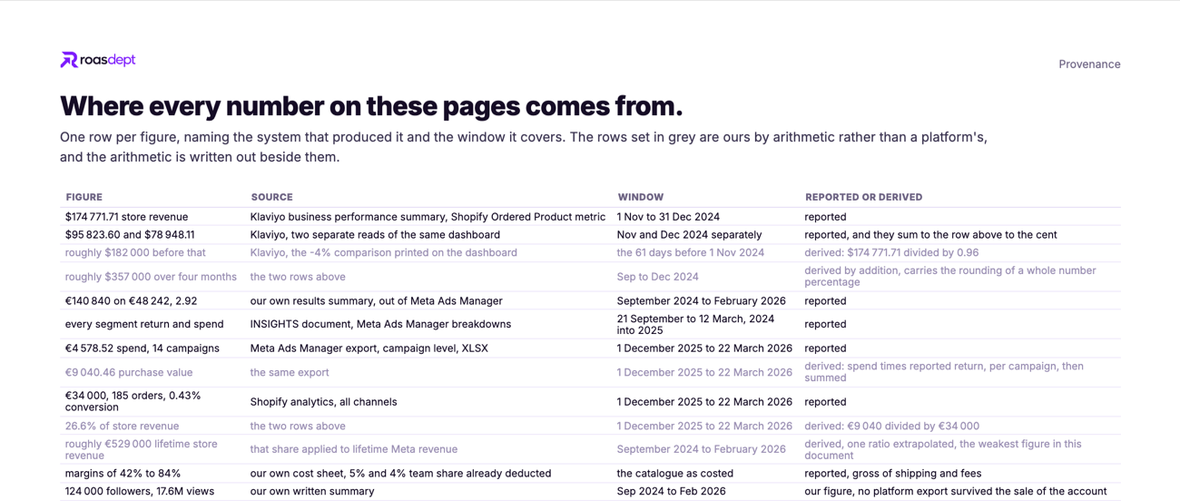
Where every number on this page comes from.
One row per figure, naming the system that produced it and the window it
covers. The rows we worked out by arithmetic are marked as derived, with the arithmetic written out beside
them.
Case study › Provenance
Reported means a platform printed it. Derived means we calculated it, and the sum is shown so you can check it.
Three gaps are named rather than filled. There is no store read between January
and November 2025, which is why the four month figure stops at four months and the lifetime figure is a
ratio rather than a total. No follower or reach export survived the sale of the account, so those two
figures are ours. And no cost of goods sits against an actual order, so the margin table is catalogue gross
margin and never a net margin per order.
We publish this page for our own brand because it is the page we would write for yours.
A number without a source and a window is a claim, not a measurement.
09
What this changes about how we read your account.
Your ad account is not your business. We size the gap between what the platform claims and what
the store banked before we touch a budget, because every decision after that depends on it.
Paid reach is an audience purchase. Spend that looks flat on a seven day window is often buying
followers who convert later on a channel with no media cost attached.
Margin sets the ceiling on testing. We read the cost sheet first. It decides how much losing you
can afford, which decides how fast you can learn.
The next step
Want your account read like this?
You get the same document we wrote for ourselves: what the platform claims, what the store banked and the gap between them. In writing, within two days.